How to Read Trend Data Without Fooling Yourself
A rising chart is not always a winning product. Learn the common ways trend data misleads sellers and how to read it properly before you buy stock.
Mohamad Mouaz
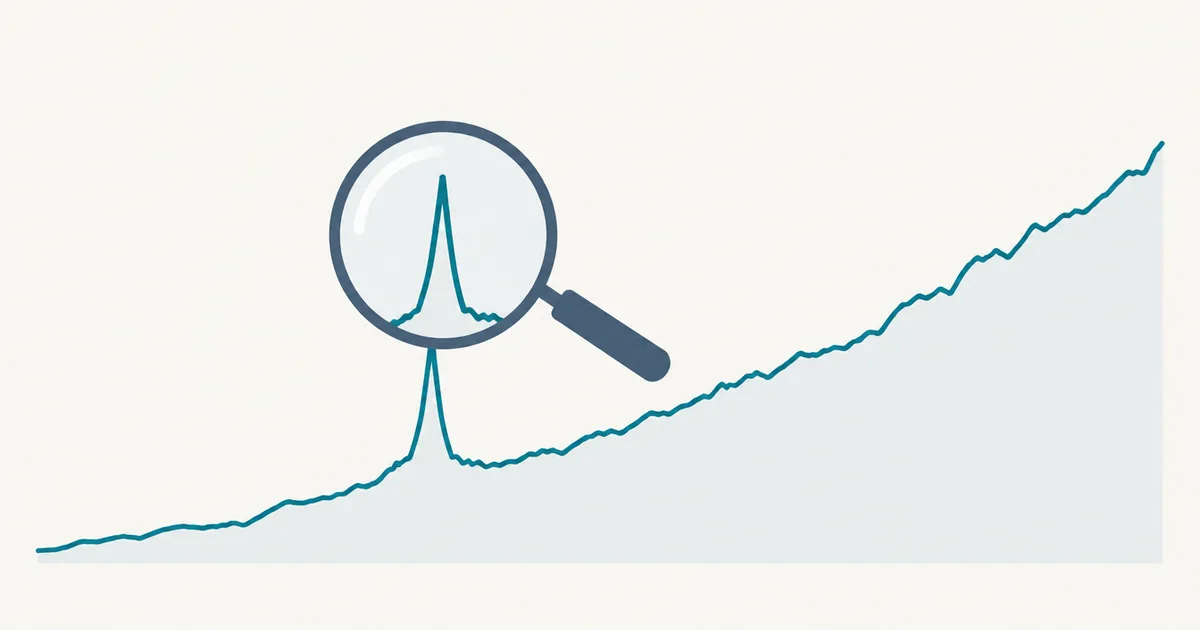
A line on a chart goes up and to the right, and suddenly you are sure you have found a winner. I have felt that rush. It is also how a lot of small stores end up with a garage full of stock nobody wants.
Trend data is useful. It is also very easy to misread. This post is about the handful of mistakes I see most, and how to avoid them before you spend money.
A spike is not a trend
Start with the shape. A sharp one-week spike that falls straight back down is a news story, a viral clip or a celebrity moment. It is not demand you can build a business on.
What you want to see is a steady climb that holds. A gentle rise over many months, with the line staying above where it started, tells you people keep coming back to the topic. That is the kind of curve worth your attention.
If you have only looked at the last thirty days, zoom out. A wide view often turns an exciting breakout into a boring bump, which is exactly why you should look.
Check the same period last year
Many products rise and fall with the calendar. Search interest in a heater climbs every autumn. If you see it climbing in October and call it a breakout, you have confused the season with the trend.
The fix is cheap. Look at the same months in earlier years. If the same hump appears every year, you are looking at a seasonal product. That is fine, as long as you plan stock and ads around the season instead of treating it as a surprise. I go deeper on this in the difference between seasonal and evergreen products.
Relative numbers lie about size
Most free trend tools show a scale, not a count. A line that reaches the top of the chart means "the most interest this term ever had," not "a lot of people." A tiny niche can look huge on its own chart.
So always ask the second question: how big is it in absolute terms? You can answer roughly by comparing your term against a broad, well-known term in the same field. If your product's interest is a rounding error next to the broad term, the market may be real but small.
Watch the words people use
Interest in a topic is not the same as interest in buying. People search "how to fix a leaky tap" far more than they search for a particular wrench. Make sure the phrase you are tracking sounds like someone ready to buy, not someone curious.
Words like "best," "buy," "for" followed by a use case, and specific model names usually signal intent. General how-to phrases usually do not.
Rising demand can still be a crowded field
Here is the part that catches careful people. You can read the data perfectly and still pick a bad product, because everyone else read the same chart.
Demand tells you people want something. It says nothing about how many sellers are already chasing them. After you confirm the trend, look at who is selling, how they price and what their reviews complain about. That second step is where competitor research earns its keep.
Be suspicious of data that agrees with you
Here is a habit that has saved me from a few bad calls. When a chart confirms what I already hoped, I go looking for a reason it might be wrong. Is the date range flattering? Is the region too narrow? Did I pick the one phrase that happens to look good?
It feels backwards, but it works. If an idea survives an honest attempt to break it, you can trust it more. If it falls apart, you found out for the price of a few minutes instead of a purchase order.
Put the pieces together
When I look at a product idea, I run through the same quick sequence.
First, I check the long view for a steady climb, not a spike. Second, I compare the same months in previous years to rule out a seasonal bump. Third, I judge the size against a broad term. Fourth, I confirm the search words sound like buyers. Fifth, I look at the competition before I get attached.
None of this takes long once you have a routine. The point is to slow down your excitement by about ten minutes, which is cheap insurance against a very expensive mistake.
Where a tool helps
Doing all of this by hand across many ideas gets tiring fast. That is the reason I built TrendHunterNeo: it pulls live trend data and competitor storefronts together and gives you a verdict in under a minute, so you can screen ideas quickly and spend your own time on the ones that survive.
But the thinking above works with or without any tool. A free chart and a notepad are enough to avoid the worst mistakes.
The short version
Trust steady climbs over spikes. Check the calendar. Question the scale. Listen to buyer words. Then look at the competition. If a product passes all five, it has earned a closer look, and that is all trend data can really promise you.
Find your next winning product with
TrendHunterNeo
AI-powered research that scans live trend data and competitor storefronts, then returns a profitability verdict in under a minute. Validate a product idea before you spend on inventory or ads.